www.navchun.com
SA Covid-19
Stats last updated on 2022-07-30
Data source: SA Department of Health www.health.gov.za/
© Copyright.
SA Covid-19 SA Covid Stats SA Covid-19 stats South Africa Covid South Africa Covid-19 #SA Covid-19 stats
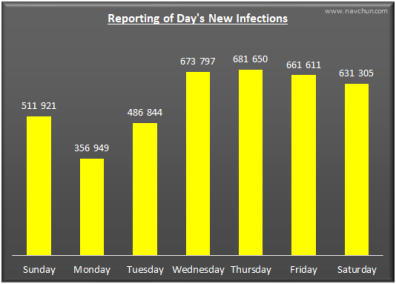
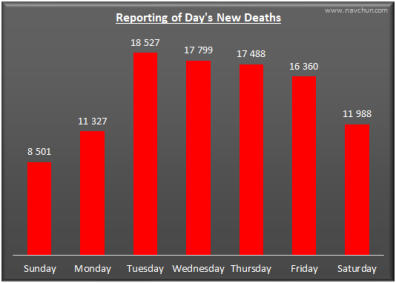
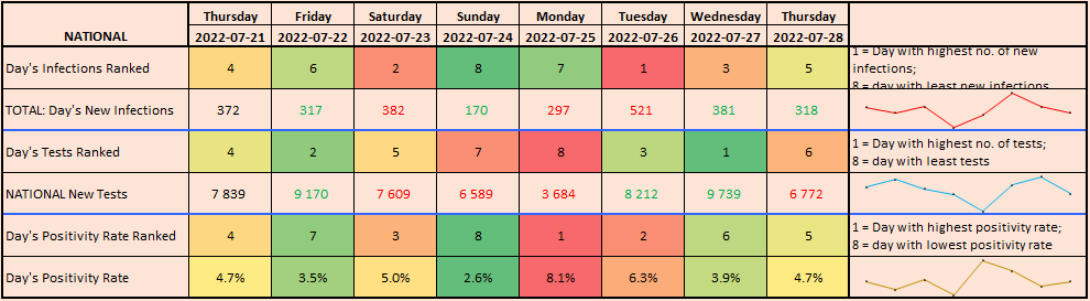
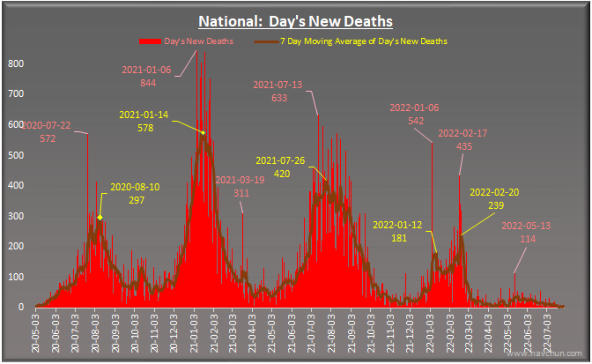
The 3 charts below reflect the number of new infections, deaths, and percentage of tests reported per day of the week. The least number of new infections and daily tests conducted were reported on Mondays. The most number of deaths were reported on Tuesdays:
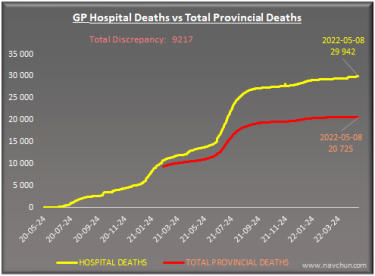
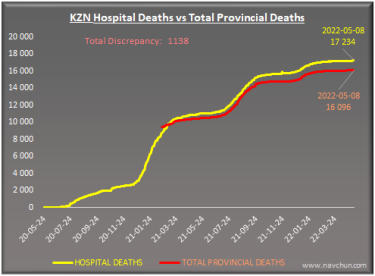
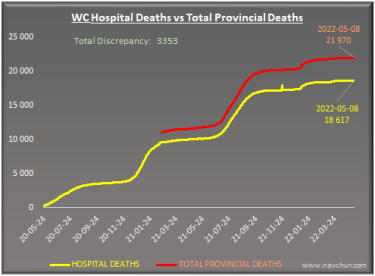
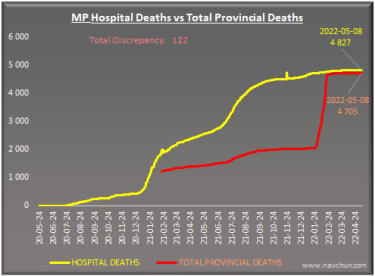
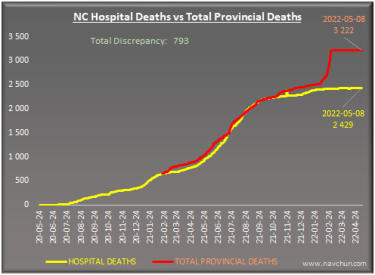
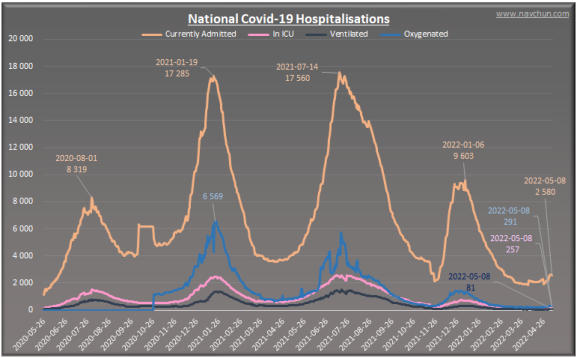
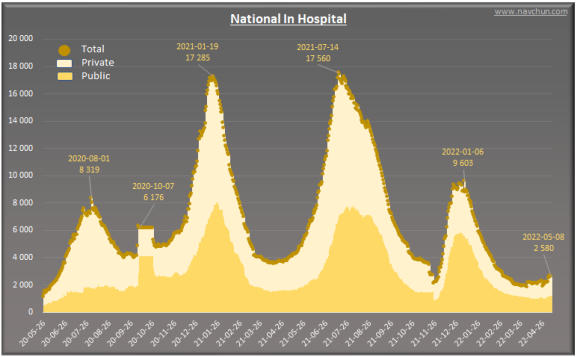
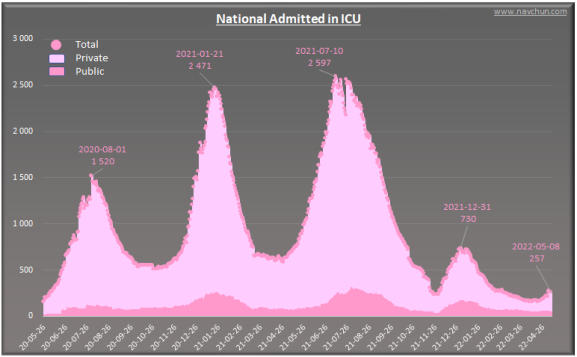
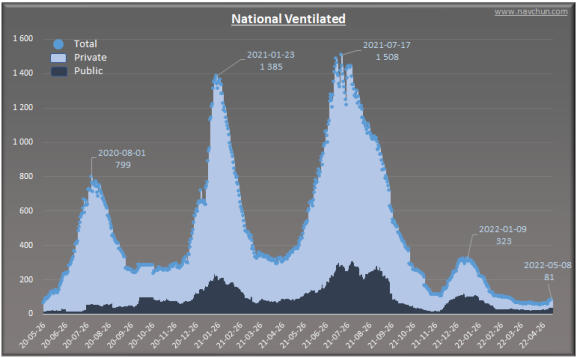
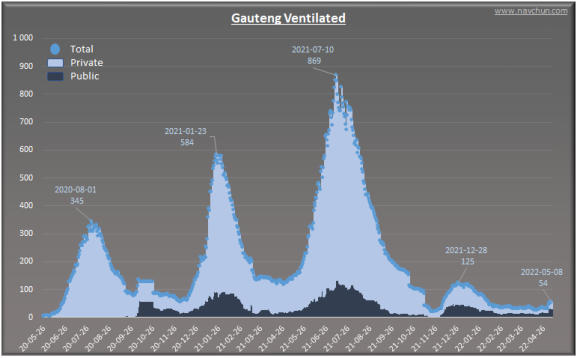
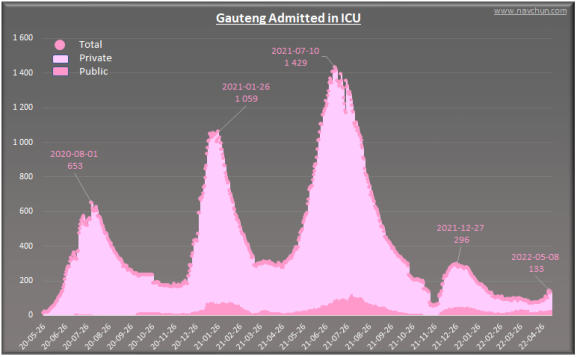
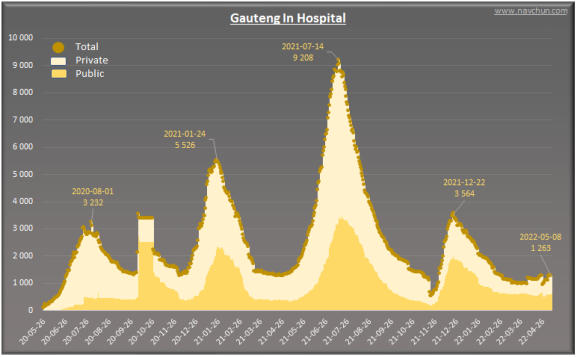
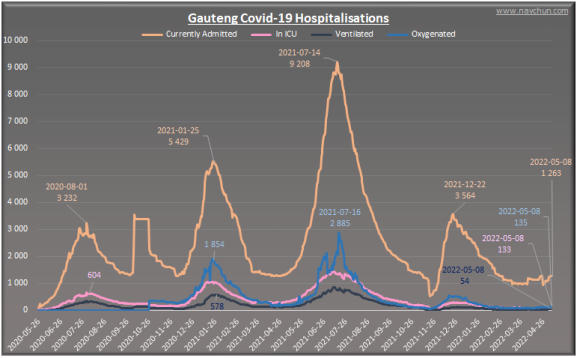
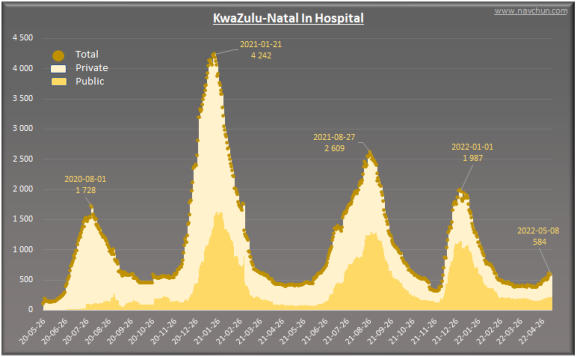
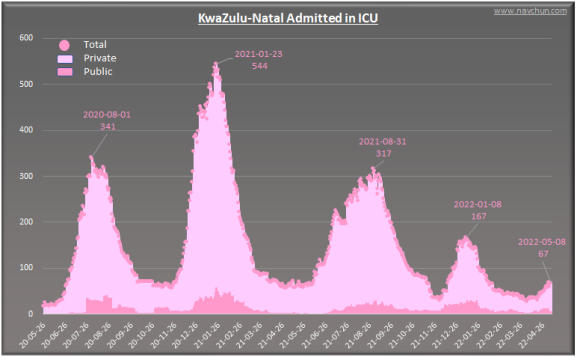
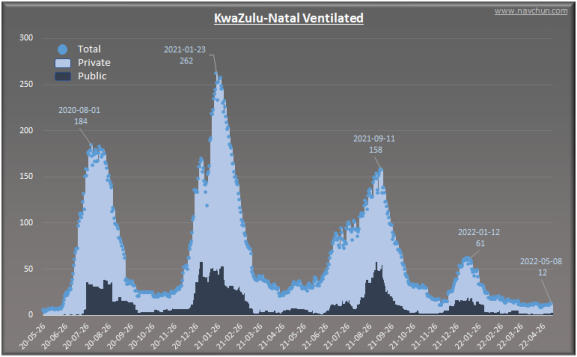
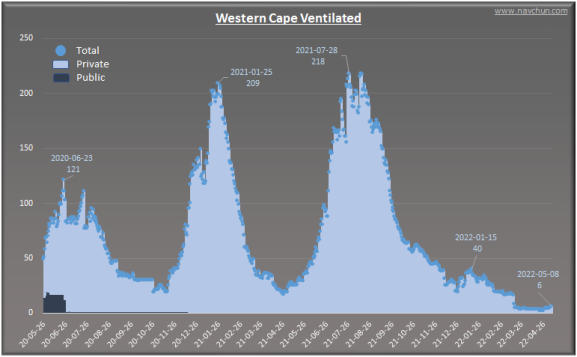
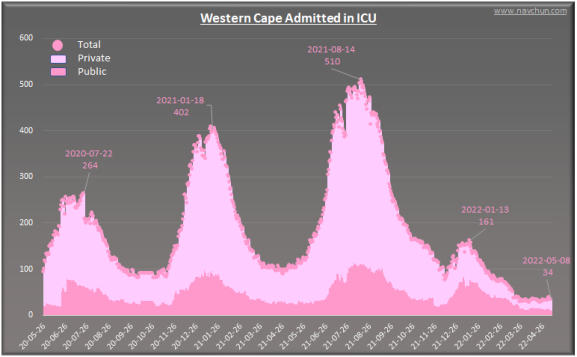
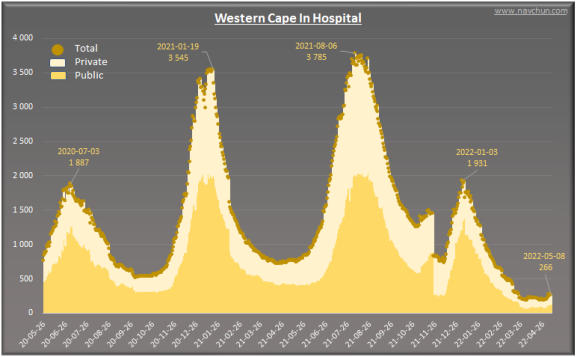
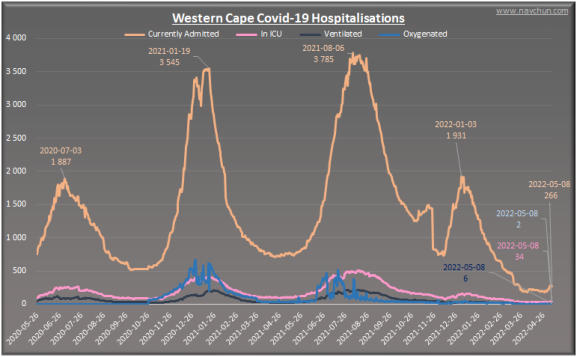
COVID Hospitalisation:
There are 2 organisations that report covid statistics daily in South Africa, the Department of Health (Total Provincial Deaths) and the National Institute for Communicable Diseases (Hospital Deaths). These charts reflect those statistics. 
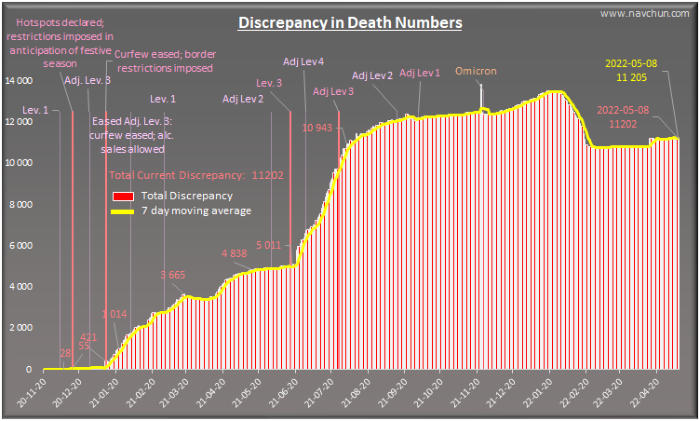
The “Discrepancy” chart shows the difference in the number of deaths, where in-hospital deaths are higher than the total provincial deaths.
3k 6k 9k 12k 15k 18k 21k 24k 27k 30k 33k 36k 39k 42k 45k 48k 51k 54k 57k 60k 63k 66k 69k 72k 75k 78k 81k 84k 87k 90k 93k 96k 99k 102k 99 days 19 13 13 20 36 42 23 11 7 6 5 7 5 7 12 23 44 45 21 9 9 7 8 9 9 9 12 17 73 38 24 17 ? 99 Cumul 118 131 144 164 200 242 265 276 283 289 294 301 306 313 325 348 392 437 458 467 476 483 491 500 509 518 530 547 620 658 682 699 Cumul SARS-CoV-2 DEATHS IN SOUTH AFRICA DAYS IT TOOK TO REACH EACH THRESHOLD www.navchun.com 100k 200k 300k 400k 500k 600k 700k 800k 900k 1M 1.1M 1.2M 1.3M 1.4M 1.5M 1.6M 1.7M 1.8M 1.9M 2.0M 2.1M 2.2M 2.3M 2.4M 2.5M 2.6M 2.7M 2.8M 2.9M 3.0M 3.1M 3.2M 3.3M 3.4M 3.5M 3.6M 3.7M 3.8M 3.9M 4.0M 4.1M 109 14 9 8 9 20 56 48 15 9 7 6 6 8 27 82 27 11 7 6 5 5 7 9 9 9 9 10 26 65 7 4 5 6 12 23 47 47 15 74 ? 109 Cumul days 123 132 140 149 169 225 273 288 297 304 310 316 324 351 433 460 471 478 484 489 494 501 510 519 528 537 547 573 638 645 649 654 660 672 695 742 789 804 863 days SARS-CoV-2 INFECTIONS IN SOUTH AFRICA DAYS IT TOOK TO REACH EACH THRESHOLD www.navchun.com 2022-07-28 Total  Deaths Day's New  Deaths Total  Recoveries Day's New  Recoveries Active  Cases Total  Infections Day's New  Infections New Tests Vaccines  Administered TOTAL 101 977 10 3 897 293 1 676 4 931 4 004 201 318 6 772 Total: Eastern Cape 16 876 4 347 073 21 226 364 175 16 37 179 144 Free State 7 826 0 207 054 0 1 200 216 080 16 Gauteng 21 014 0 1 303 694 511 744 1 325 452 131 Phase 2: KwaZulu-Natal 16 246 4 700 014 0 838 717 098 37 36 699 376 Limpopo 4 675 0 154 957 14 41 159 673 8 Mpumalanga 4 764 0 197 284 0 183 202 231 24 North West 5 019 0 196 918 0 98 202 035 4 Sisonke Prog.: Northern Cape 3 249 0 111 991 85 55 115 295 0 741 784 Western Cape 22 308 2 678 308 1 045 1 546 702 162 82 www.navchun.com
On 01 August 2022, the South African Department of Health stopped publishing daily Covid-19 statistics.
TOP
Provincial Overview